SuperBowl Predictions- New England Patriots vs. Seattle Seahawks
Emilio Sanchez Pulido
BANL-6320-01- Supervised Machine Learning
Armando Rodriguez
This paper uses regular‑season offensive and defensive performance to project the score and likely winner of the Super Bowl matchup between the New England Patriots and the Seattle Seahawks. The goal is to translate raw team statistics into a simple, transparent model that produces a point spread, an expected final score, and a win probability for each team.
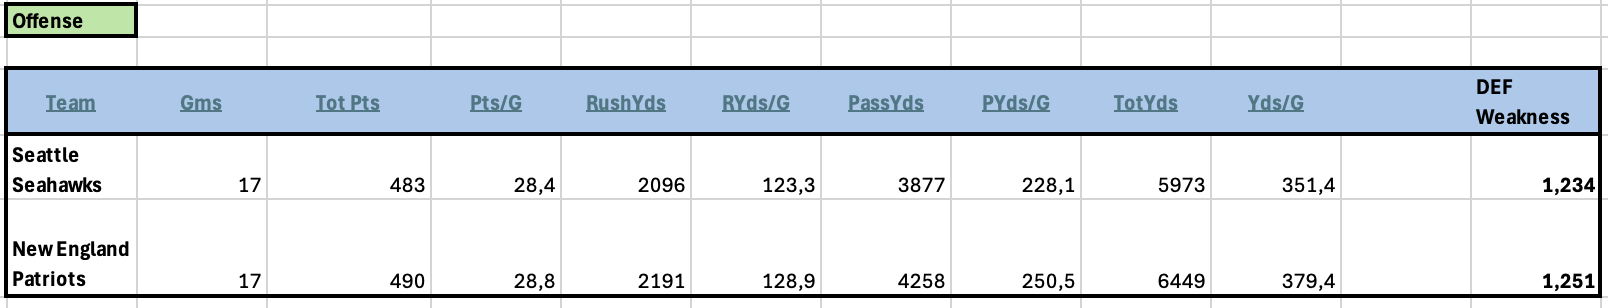
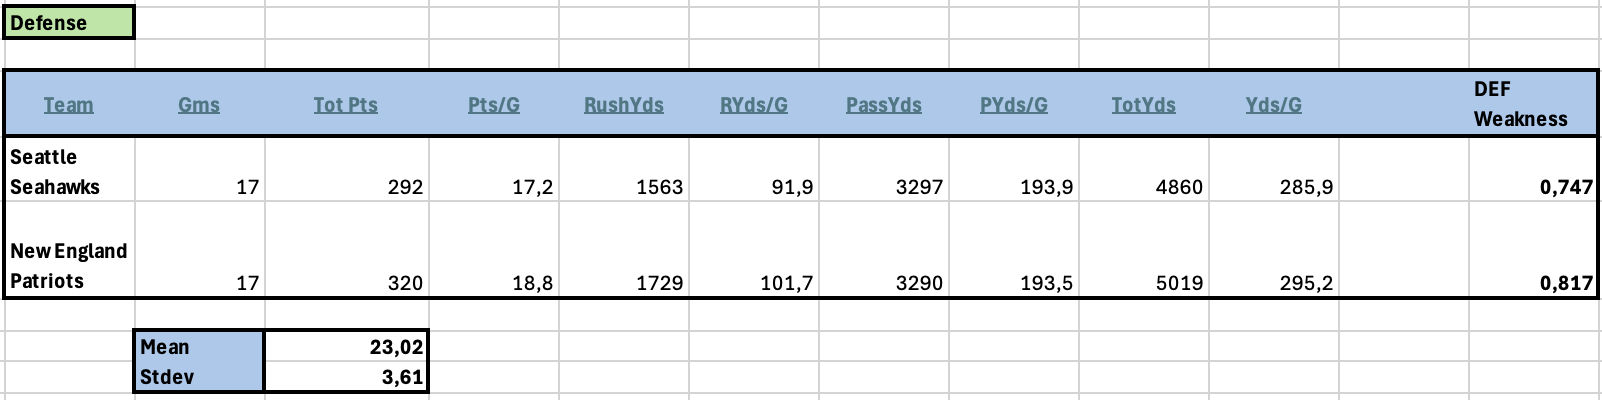
The dataset covers all 17 regular‑season games for the Seattle Seahawks and New England Patriots, with league scoring averaging 23.02 points per game and a standard deviation of 3.61 points. Both defenses are stronger than this baseline: Seattle allows 292 points (17.2 per game) and New England 320 points (18.8 per game), summarized by Defense Weakness values of 0.747 for Seattle and 0.817 for New England, where lower numbers indicate better performance.
Offensively, both teams rank well above league average. Seattle scores 483 points (28.4 per game) and New England 490 points (28.8 per game), with corresponding Attack Strength ratings of 1.234 and 1.251. These ratings capture the central idea of the dataset: compared with an average NFL team, the Patriots and Seahawks combine efficient, high‑scoring offenses with top‑tier defenses, with Seattle holding a slight edge on defense and New England a small advantage on offense.
Table 1: Defensive performance, regular season
Note: This table reports points and yards allowed by New England and Seattle across 17 regular‑season games, along with a Defense Weakness index benchmarked to the league averages of 23.02 points and 3.61 points per game.
Table 2: Offensive performance, regular season
Note: This table summarizes points and yards gained by both teams over 17 games and converts them into an Attack Strength rating that compares each offense with the league average.
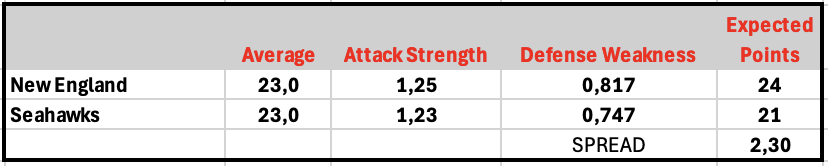
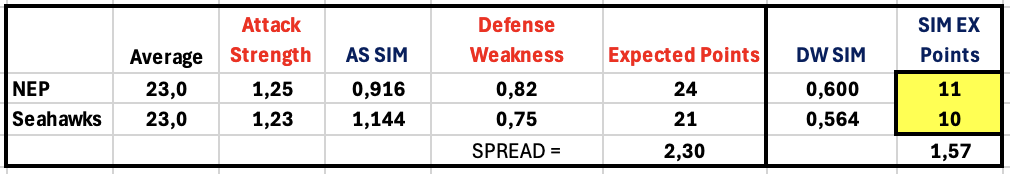
The model combines each team’s offensive and defensive efficiency into a single expected‑points estimate. League scoring is centered at an average of 23.0 points per game, which serves as the baseline. Each offense is summarized by an Attack Strength rating (1.25 for New England, 1.23 for Seattle), and each defense by a Defense Weakness rating (0.817 for New England, 0.747 for Seattle).
Expected points are calculated by applying these ratings to the league baseline. For New England, the combination of a 1.25 Attack Strength facing a 0.747‑level defense yields an expected 24 points; for Seattle, a 1.23 Attack Strength against a 0.817‑level defense produces an expected 21 points. The difference between these two values defines the model spread of 2.30 points in favor of the Patriots.
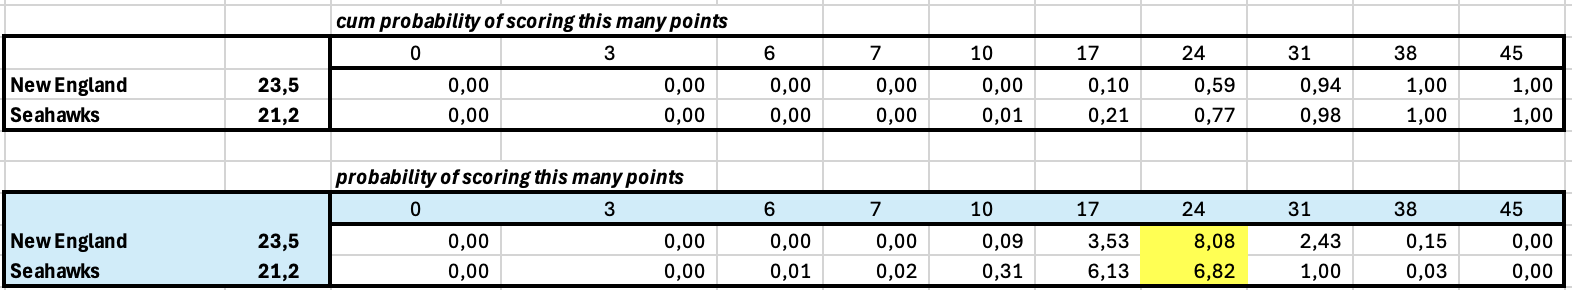
To move from single point estimates to full score distributions, the model uses a normal approximation around each team’s mean. In the second panel, New England’s mean is 23.5 points and Seattle’s is 21.2 points, and the sheet computes the cumulative probability that each team scores at least 0, 3, 6, 7, 10, 17, 24, 31, 38, or 45 points. The final panel converts these into point‑by‑point probabilities; for example, New England has about an 8.08 percent chance of finishing on exactly 24 points, while Seattle’s chance of hitting 24 is roughly 6.82 percent. These distributions form the basis for the game simulation and win‑probability calculations in the next step.
Table 3: Expected points and scoring distribution
Note: Using Attack Strength and Defense Weakness, this table derives expected points for each team (24 for New England, 21 for Seattle) and shows the cumulative probability of reaching key scoring thresholds in the game.
Table 4: Probability of exact final scores
Note: This panel converts the scoring distributions into the probability of each team finishing on specific point totals, highlighting how often New England and Seattle are projected to land on common scores such as 17 or 24.
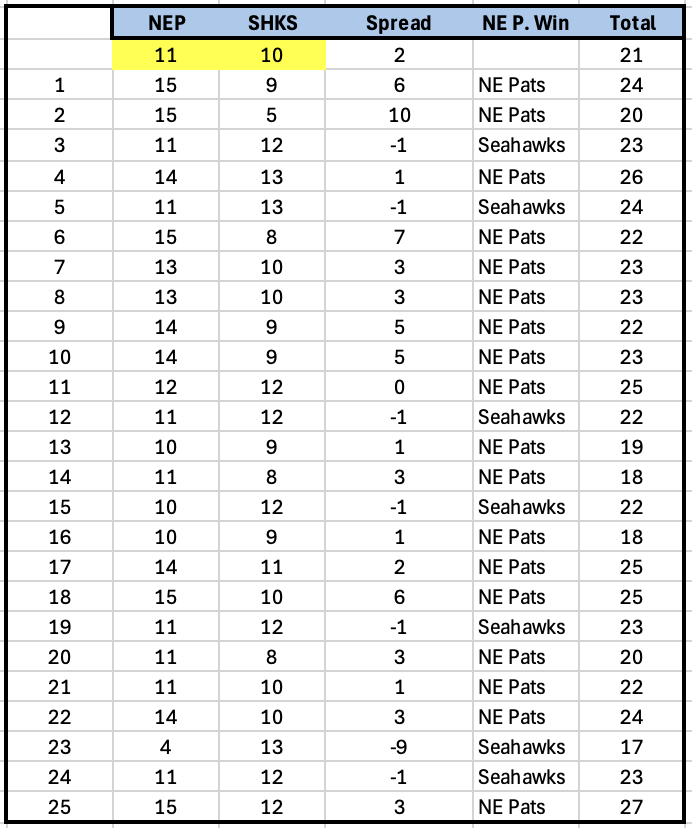
Using the expected values of 24 points for New England and 21 points for Seattle, we simulated 1 000 games by drawing random scores around those means and recording the winner of each trial. In the representative subset shown in the sheet, simulated scores such as 11–10, 15–9, and 14–13 appear frequently, with New England winning the majority of realizations. Across the full set of 1 000 simulated games, the Patriots win 74.5 percent of the time, while the Seahawks win 25.5 percent of the time, implying that New England should be considered a clear but not overwhelming favorite.
The average simulated scoreline is close to the model’s expected points, with New England typically landing in the low‑to‑mid‑20s and Seattle clustered just below that range. Even in scenarios where both teams score in the teens, the Patriots’ slightly higher offensive rating and comparable defensive strength allow them to edge out more close games than they lose.
Table 5: Monte Carlo simulation of game outcomes
Note: Starting from the expected scores, this simulation runs 1 000 random games, lists sample scorelines, and records the winner of each trial to estimate New England’s overall win probability.
Overall, the model points to a modest but consistent advantage for New England. Using regular‑season efficiency, the Patriots project to score about 24 points against 21 for Seattle, and they win roughly three quarters of the 1 000 simulated games. New England’s slightly stronger offense outweighs Seattle’s small defensive edge, leading to more close wins in the simulations and supporting a prediction of a narrow Patriots victory rather than a one‑sided Super Bowl.